Adaptive Box and Whisker Plot
Why Use the Adaptive Box and Whisker Plot in Sisense?
-
An exceptional visual tool that unravels concealed insights within your data.
-
Engaging and intuitive representation of dataset distribution and statistical summaries.
-
Encourages data-driven decision making.

How do Adaptive Box and Whisker Plots Work?
By allowing you to explore your data's minimum, quartiles, median, maximum values effortlessly, while efficiently identifying outliers and gaining a deeper understanding of data spread, skewness, and overall variability.
All this while making the individual data points available, this visualization tool helps you seamlessly uncover insights within your dataset.
What is an Adaptive Box and Whisker Plot?
Adaptive Box and Whisker Plot is a Sisense widget that simplifies the understanding of data distribution. Whether you're analyzing sales, test scores, health indicators, or any numerical data, rely on the Adaptive Box and Whisker Plot as your trusted companion for confident and data-driven decision-making.
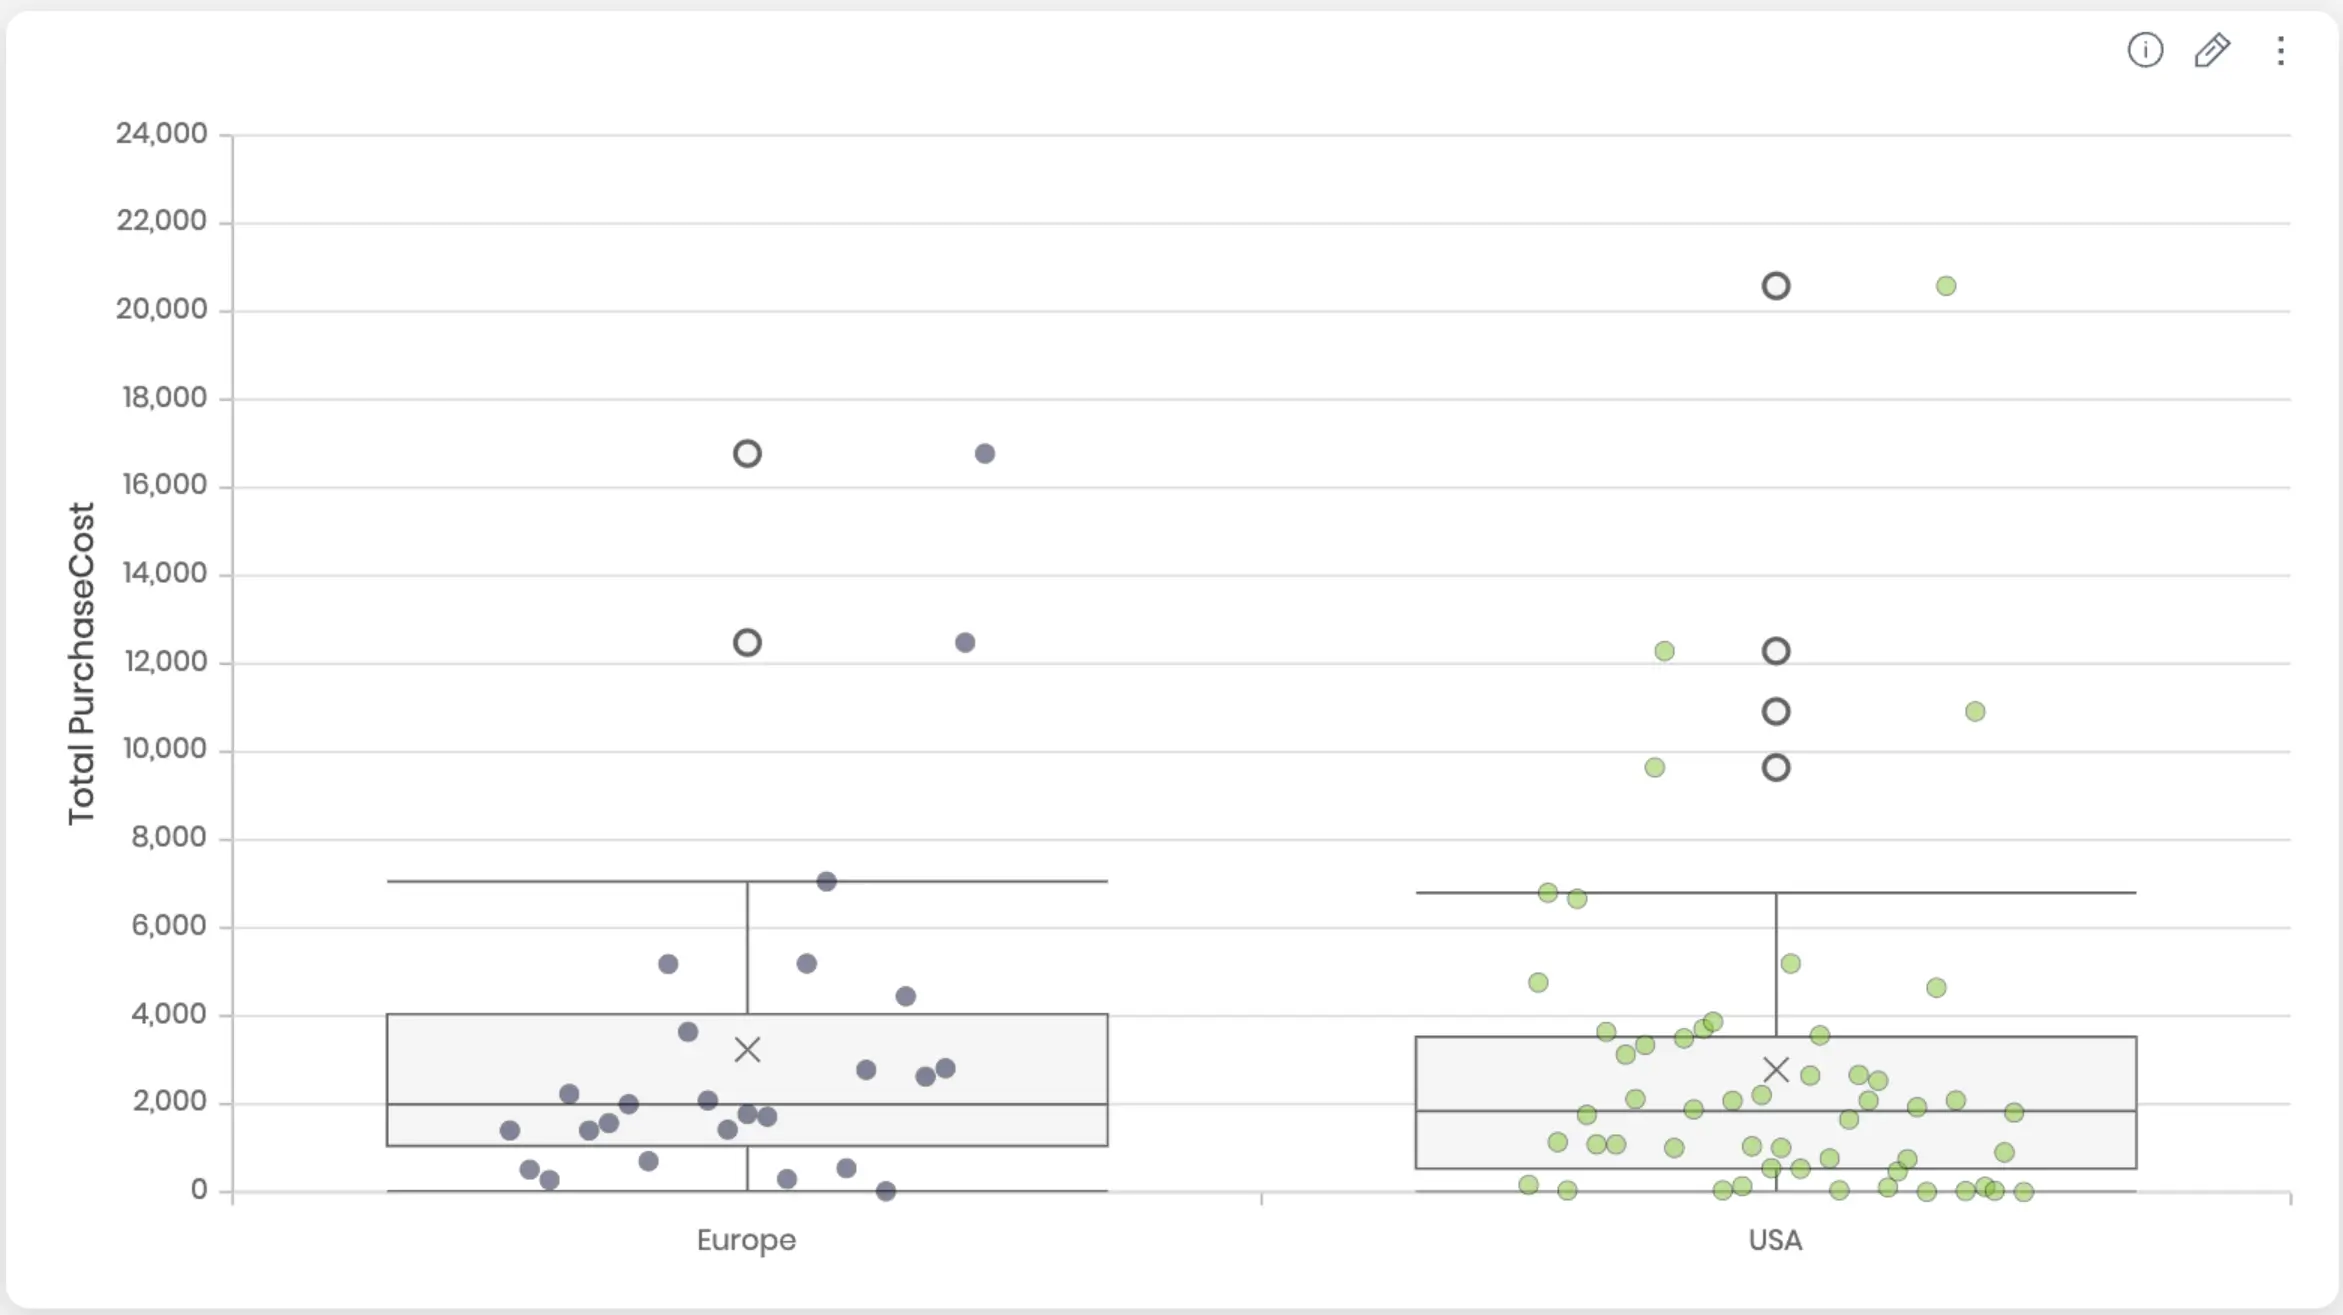
Case Study - Adaptive Box and Whisker Plot
A global e-commerce company with a substantial customer base and diverse product catalog faced the challenge of comprehending sales patterns and outliers within their data. Seeking a solution for deeper insights, they turned to RAPID BI's Adaptive Box and Whisker Plot. This tool transformed their data analysis process by offering intuitive graphical representations of distributions, quartiles, and outliers.
Utilizing the Adaptive Box and Whisker Plot, they identified high and low performing products and channels, ranges, and outliers, enhancing their understanding of sales patterns. Armed with this information, they optimized inventory, pricing, and marketing strategies, all while gaining valuable insights through data-driven decisions.
The Adaptive Box and Whisker Plot empowered them to unlock concealed insights, transforming their analytical capabilities.
Whatever your business is, embrace the Adaptive Box and Whisker Plot's potential to deepen data understanding and revolutionize analysis. Let this visualization tool redefine the way you interpret and analyze your data.
Next Steps?
RAPID BI's Adaptive Analytics add-ons are designed to cater to the dynamic needs of your business intelligence operations, by enhancing the user experience and facilitating seamless data analysis.
Adaptive Box and Whisker Plots are often used along with the Adaptive Filters , which allows users to make filter selections within the page using elegant dropdown selections with a range of advanced features and functionality.
If you are interested in multiple add-ons by RAPID BI, consider a RAPID BI Tools Membership which enables access to all RAPID BI’s add-ons for an annual fee that can save you $$$$.
RAPID BI provides services to clients across the globe, is equipped to operate in a variety of time zones and handle multiple currencies. Our team boasts over 20 years of cumulative experience with Sisense, and our singular business focus is to assist Sisense clients in extracting maximum value from their data.
Have custom or specific requirements?
Awards & Certifications

Sisense Certified Partner
Issued by: Sisense

Sisense Compose SDK Certified
Issued by: Sisense

Sisense UX Dashboard Design
Issued by: Sisense
Sisense BloX Certified
Issued by: Sisense

Sisense First Line Support
Issued by: Sisense
Featured News

Aged Care Analytics
The Australia Royal Commission into Aged Care reported in early 2021. The final report highlighted nearly AU$10B of additional funding...
Read More
RAPID BI helps Flexihire increase utilisation using Sisense leading BI software
Flexihire hires out construction and industrial equipment across Queensland and NSW, Australia, to keep local industry operating...
Read More
Benchmarking, Data Monetization and Embedded BI
Your software product is doing well, the customer base is expanding and you’re well thought of in your market, so what’s next? ...
Read More