3D Deck GL Maps
Why Use 3D Deck GL Maps in Sisense?
-
Engaging visuals that show data by location and look amazing.
-
Ease of use. Guides you through a simple process to load your shapes and data.
-
Highly Customizable with no Code
-
High Performance

How does the 3D Deck GL Maps Sisense Add-On Work?
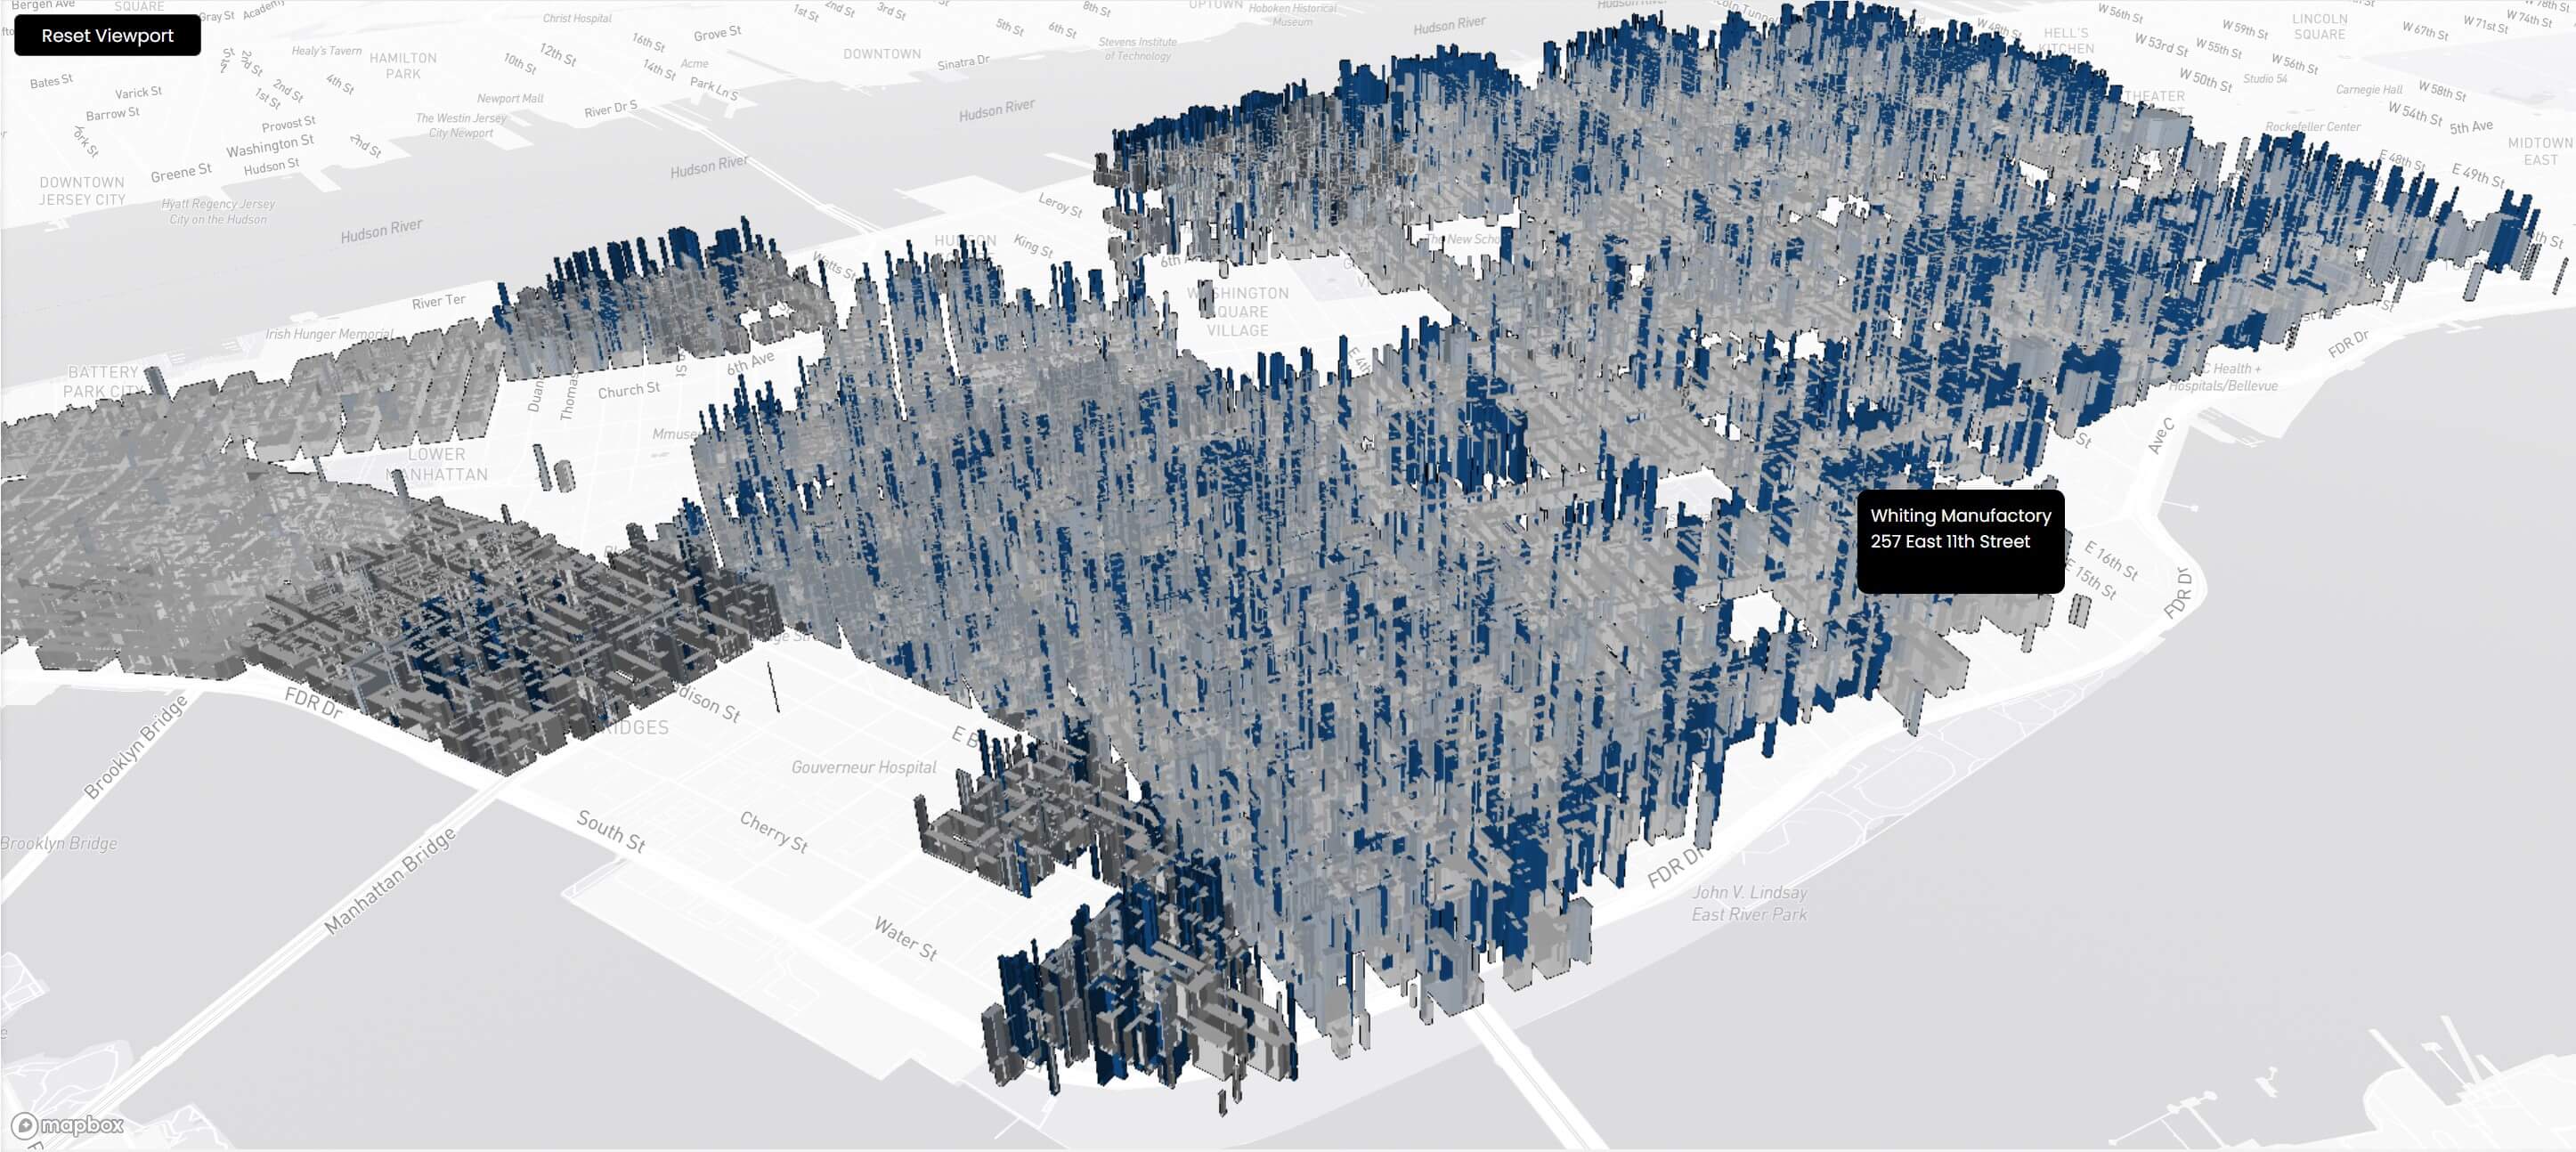
RAPID BI's 3D Deck GL Maps combines Deck GL maps with GeoJSON shapes, and your Sisense data, to provide outstanding visuals for your dashboards.
Differentiating geographical areas, and highlighting differences with color and shape height, creates a highly engaging way to view data that allows end users to garner insights that may otherwise be missed. A picture tells a thousand words.
It integrates with Sisense data and dashboards seamlessly.
Our 3D Deck GL Maps Sisense add-on performs well with a large number of custom GeoJSON shapes. In the below example we loaded over 60,000 building shapes from NYC into a map. Although most of our customers use the maps for geo-regions like postcode, zipcode, county, government area, state, country etc, rather than individual buildings, we set up this example to demonstrate that volume of data is not likely to be an issue. The UI remains responsive as chunks of data are added to the map during loading.
What can I do with the 3D Deck GL Maps Sisense Add-On?
High resolution shapes are pre-loaded including USA states, Australian LGA's and Postcodes, and countries of the world. Need something different? No problem, the Add-On allows you to upload your GeoJSON file directly into the widget, and you are good to go. Any issues or need help, we are here to support you.
We have built this Add-On from the ground up with performance as a key consideration. This allows you to load more shapes at higher resolution for more beautiful visuals.
Advanced functionality is available in the design panel with no-code.
For example, custom tooltips that can include additional data and text, configurable clickable items (filter the dashboard on a dimension of your choosing), mapping and zooming options and much more.
Case Study - 3D Deck GL Maps
A Sisense client wished to highlight sales by postcode and as a proportion of population for each postcode. The idea was that the user could look at the map, zoom in on the areas of interest, and see at a glance where sales were being made, where the population was more dense, and what percentage of the population was be serviced.
They turned to RAPDI BI and the 3D Deck GL Maps add-in.
By using the color to show the strength of sales, height to show population, and placing additional information in the tooltip, users were empowered to use the data to make better decisions. This led to a 10% increase in sales.
No doubt, the fast performance of the maps and visual representation of the data were key drivers in an uptick in the usage of BI, and also unlocked valuable insights for their users.
The 3D Deck GL Maps add-on proved to be a game-changer, empowering users and the organization to make better use of their data.
Next Steps?
RAPID BI's Adaptive Analytics add-ons are designed to cater to the dynamic needs of your business intelligence operations, by enhancing the user experience and facilitating seamless data analysis.
3D Deck GL Maps is often used along with the Adaptive Filters, which allows users to make filter selections within the page using elegant dropdown selections with a range of advanced features and functionality.
If you are interested in multiple add-ons by RAPID BI, consider a RAPID BI Tools Membership which enables access to all RAPID BI’s add-ons for an annual fee that can save you $$$$.
RAPID BI provides services to clients across the globe, is equipped to operate in a variety of time zones and handle multiple currencies. Our team boasts over 20 years of cumulative experience with Sisense, and our singular business focus is to assist Sisense clients in extracting maximum value from their data.
Have custom or specific requirements?
Awards & Certifications

Sisense Certified Partner
Issued by: Sisense

Sisense Compose SDK Certified
Issued by: Sisense

Sisense UX Dashboard Design
Issued by: Sisense
Sisense BloX Certified
Issued by: Sisense

Sisense First Line Support
Issued by: Sisense
Featured News

Aged Care Analytics
The Australia Royal Commission into Aged Care reported in early 2021. The final report highlighted nearly AU$10B of additional funding...
Read More
RAPID BI helps Flexihire increase utilisation using Sisense leading BI software
Flexihire hires out construction and industrial equipment across Queensland and NSW, Australia, to keep local industry operating...
Read More
Benchmarking, Data Monetization and Embedded BI
Your software product is doing well, the customer base is expanding and you’re well thought of in your market, so what’s next? ...
Read More